I work solely inside of Emacs, so when Emacs is down, I cannot do any
work. Emacs itself is very reliable, but there might be some risks
of downtime when upgrading Emacs or any of the 3rd party libraries
that I use.
The downtime can be minimised by always having multiple Emacs versions
and their 3rd party libraries available. This blog post documents
how I implement it.
Installation
Firstly, install each Emacs into its separate folder, e.g. on my
Debian box, I have ~/bin/emacs30.0.92/ installed 8 months ago and
~/bin/emacs30.2/ installed yesterday. This is easy to achieve by adding
the prefix option when building Emacs from source, e.g.
Then have a separate systemd service for each Emacs version. Taking
version 30.2 as an example, its unit file is saved as
~/.config/systemd/user/emacs30.2.service.
In that unit file, the Emacs executable is specified in full path to
wherever it is installed
In the unit file, I also added the initial optioninit-directory so
it has its own .emacs.d directory. It ensures the 3rd party packages
will be installed there.
Note if there is an init.el file in that directory, Emacs will use
that instead of the ancient ~/.emacs file.
GUI
Finally, to open an Emacs GUI that connects to the Emacs 30.2 daemon,
run
~/bin/emacs30.2/bin/emacsclient -s work -c .
from the command line.
I sometimes found it is more natural to have a desktop application for
GUI, so I have ~/.local/share/applications/emacsclient-30.2.desktop
file, and the content is
There could still be some risks of downtime due to conflicts between
Emacs/package versions, or caused by updating the OS/other
programs. These cases are rare, so this setup is good enough for me.
Had a chill day walking around the canal path in London, at 6:30 pm, I
was keen to continue on the home office project.
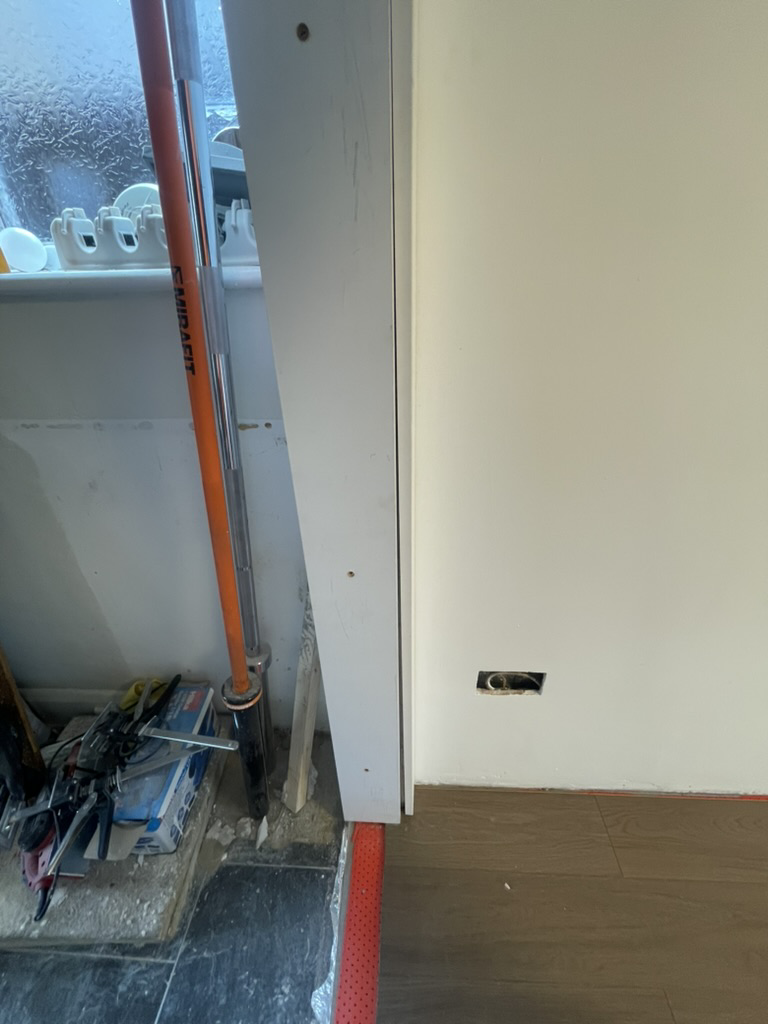
The existing wall is not plumb, so when I put the architrave, there’s
a gap. This is a typical issue, and a small gap (less than 3mm) can be
filled with deco chalk. In my case, the bottom has a 10mm gap, which I
have to address.
10mm gap at the bottom between the architrave and the wall
In general, there are two ways: either add a small piece to the door
lining to fill the gap, or rebate the architrave to accommodate the
wall protrusion. I jumped to the rebate approach as I didn’t have any
additional strips of wood for the first approach (happy skip days).
A quick measurement told me the architrave needs a rebate of 45mm
wide, and the depth varies: starting from 1300mm height, reaching to
10mm deep at the bottom.
The easiest way to do this in this scenario is to cut 10mm deep across
the board, as it is okay to have some voids behind the architrave, and
there are still 25mm for the architrave to be fixed on.
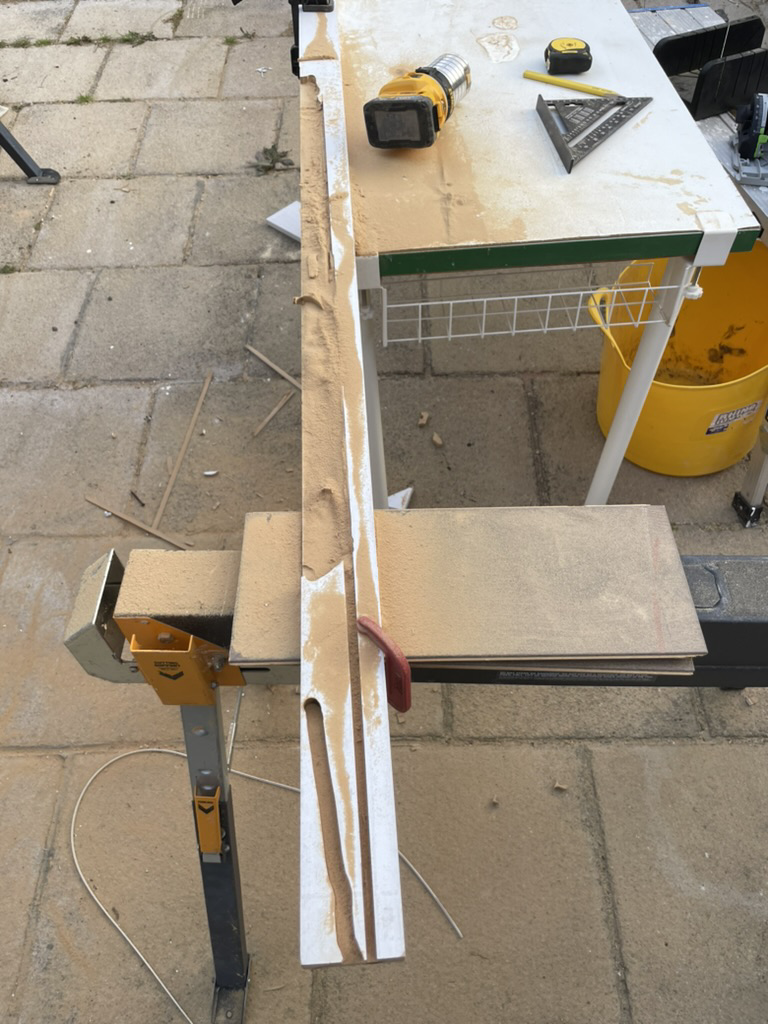
My first attempt was using a track saw: first cut was at 45mm line,
from the bottom all the way to the 1300mm mark. The next cut is right
next to the previous cut to increase the rebate area. Repeating this
process many times to get to the whole 45mm area. The groove in the
photos below is made from 3-4 passes.
With a blade kerf of size 1.8mm, I figured it requires 25 cuts to get
to 45mm. My efficiency-seeking brain took over and said: There must be
a better way.
So I pulled out the Dewalt router from the drawer, set the depth, and
clamped the architrave down to the table. The immediate problem I
faced was that it didn’t cut in a straight line: it went like 45-60
degrees for some reason, so I couldn’t cut a long groove like I had
done with a track saw.
Rebate using a track saw and a router
So I turned the router 90 degree and cut small and short chunks
instead. It worked well: the grooves I cut using a track saw serve as
a stopping line so I won’t cut extra. It was not perfect because there
were tons of dust coming out from the router, and it made so much
noise.
I put my headphones on and made a few more passes. I started seeing
how it can be done for the whole 1300m length. Then I saw my neighbour
over the fence, asking what I was doing. Well, it turned out to be
7:30 pm already, so I had to stop and leave it for tomorrow.
In hindsight, the track saw can do a much better job because I
realised only 5-10 passes would be enough. The small pieces between
grooves can be knocked off rather easily using a chisel. The track saw
has better dust collection, and the noise is much lower.
Another completely different approach is to remove the protrusion on
the wall using a multi-tool: placing the blade on the door lining so
the cuts will be flush with the door lining, and pre-cutting the 45mm
line to have a neat finish.
The standard Cat 6 plug is a pain to work with: I have to untwist the 4
pairs, make them perfectly straight, lay the 8 wires side by side with
no gaps, and then insert all of them into the RJ45 plug in one go.
It sounds easy, but since the wires are flexible, it is actually very
hard: very often the wires move around and become misaligned or
misplaced during the fitting. If that happened or any other part of it
went wrong, I would have to pull out the whole lot and restart again.
I had successes before, usually after a couple of attempts, often
accompanied by frustration in between. It requires me to activate the
fight mode, give it 100% focus while sitting in an “Orz”
position1, so there’s quite a lot of energy poured into it.
At Height
However, even if I want to, it becomes physically impossible when it
comes to fitting a plug in the air for the CCTV cameras: the ladder is
a bit wobbly with uneven ground underneath it, and it is windy and
raining due to a summer storm.
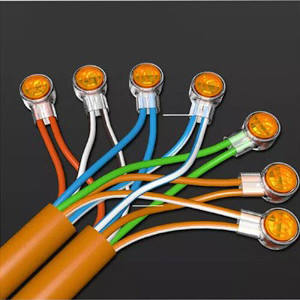
Since I wasn’t happy with the normal Cat 6 plug, I was keen to try new
products. So when I first saw the IDC Punch Down to RJ45 Plug from
Kenable2, I ordered a few. It turned out to be a smart little
move (this time).
This product has a built-in RJ45 plug that is already wired up, so I
can skip that difficult part. All I have to do is punch down the wires
into the IDC terminal. Punching down itself is very easy; I can do it
half-minded with one hand.
Another benefit is that I can split the fitting into multiple steps,
and I can take mini breaks for my arms between steps. Once one or two
wires are inserted into the IDC terminal, it binds the cable to the
plug. The binding is strong, so it hangs in the air and swings a bit
with the wind with no issues. Then I take my time for the rest of the
wires. If you don’t appreciate how important it is, trust me, your
arms become rather fatigued when working with your hands overhead.
I had to extend the main Ethernet cable that connects the main router
in the living room to the secondary router in the new
office. Technically, the cable size is spot on, but I had to cut back
2-3 times because a combination of my lack of experience and the LAP
data module from Screwfix is rubbish.
It seems like an unusual task given that there are only a few products
available on the market. I tested two, and I am happy with the
results, so I am documenting here for people who might find it useful.
Jelly Crimps
The first product I tested was from my electrician. It took me a while
to find out that its name is Jelly Crimps. You can get it from TLC or Amazon.
The little connector has two long sleeves that host two wires. It has
a button in the middle; press it very hard, and it will release the
gel. I highly recommend using a piler unless you have super strong
figures.
The process is simply: insert the wires, press with a piler to release
the gel, and repeat 8 times for each wire.
Jelly Crimps in Use
It costs about £0.2 to extend one cable, so it is very
cost-effective. I wasn’t sure it would work, but it does, and my
electrician vouches for it.
The only problem with this product is that it is not
maintenance-free. According to my electrician, I will have to put
these connectors into a back box and put a front cover over it, which
changes it to a much bigger job.
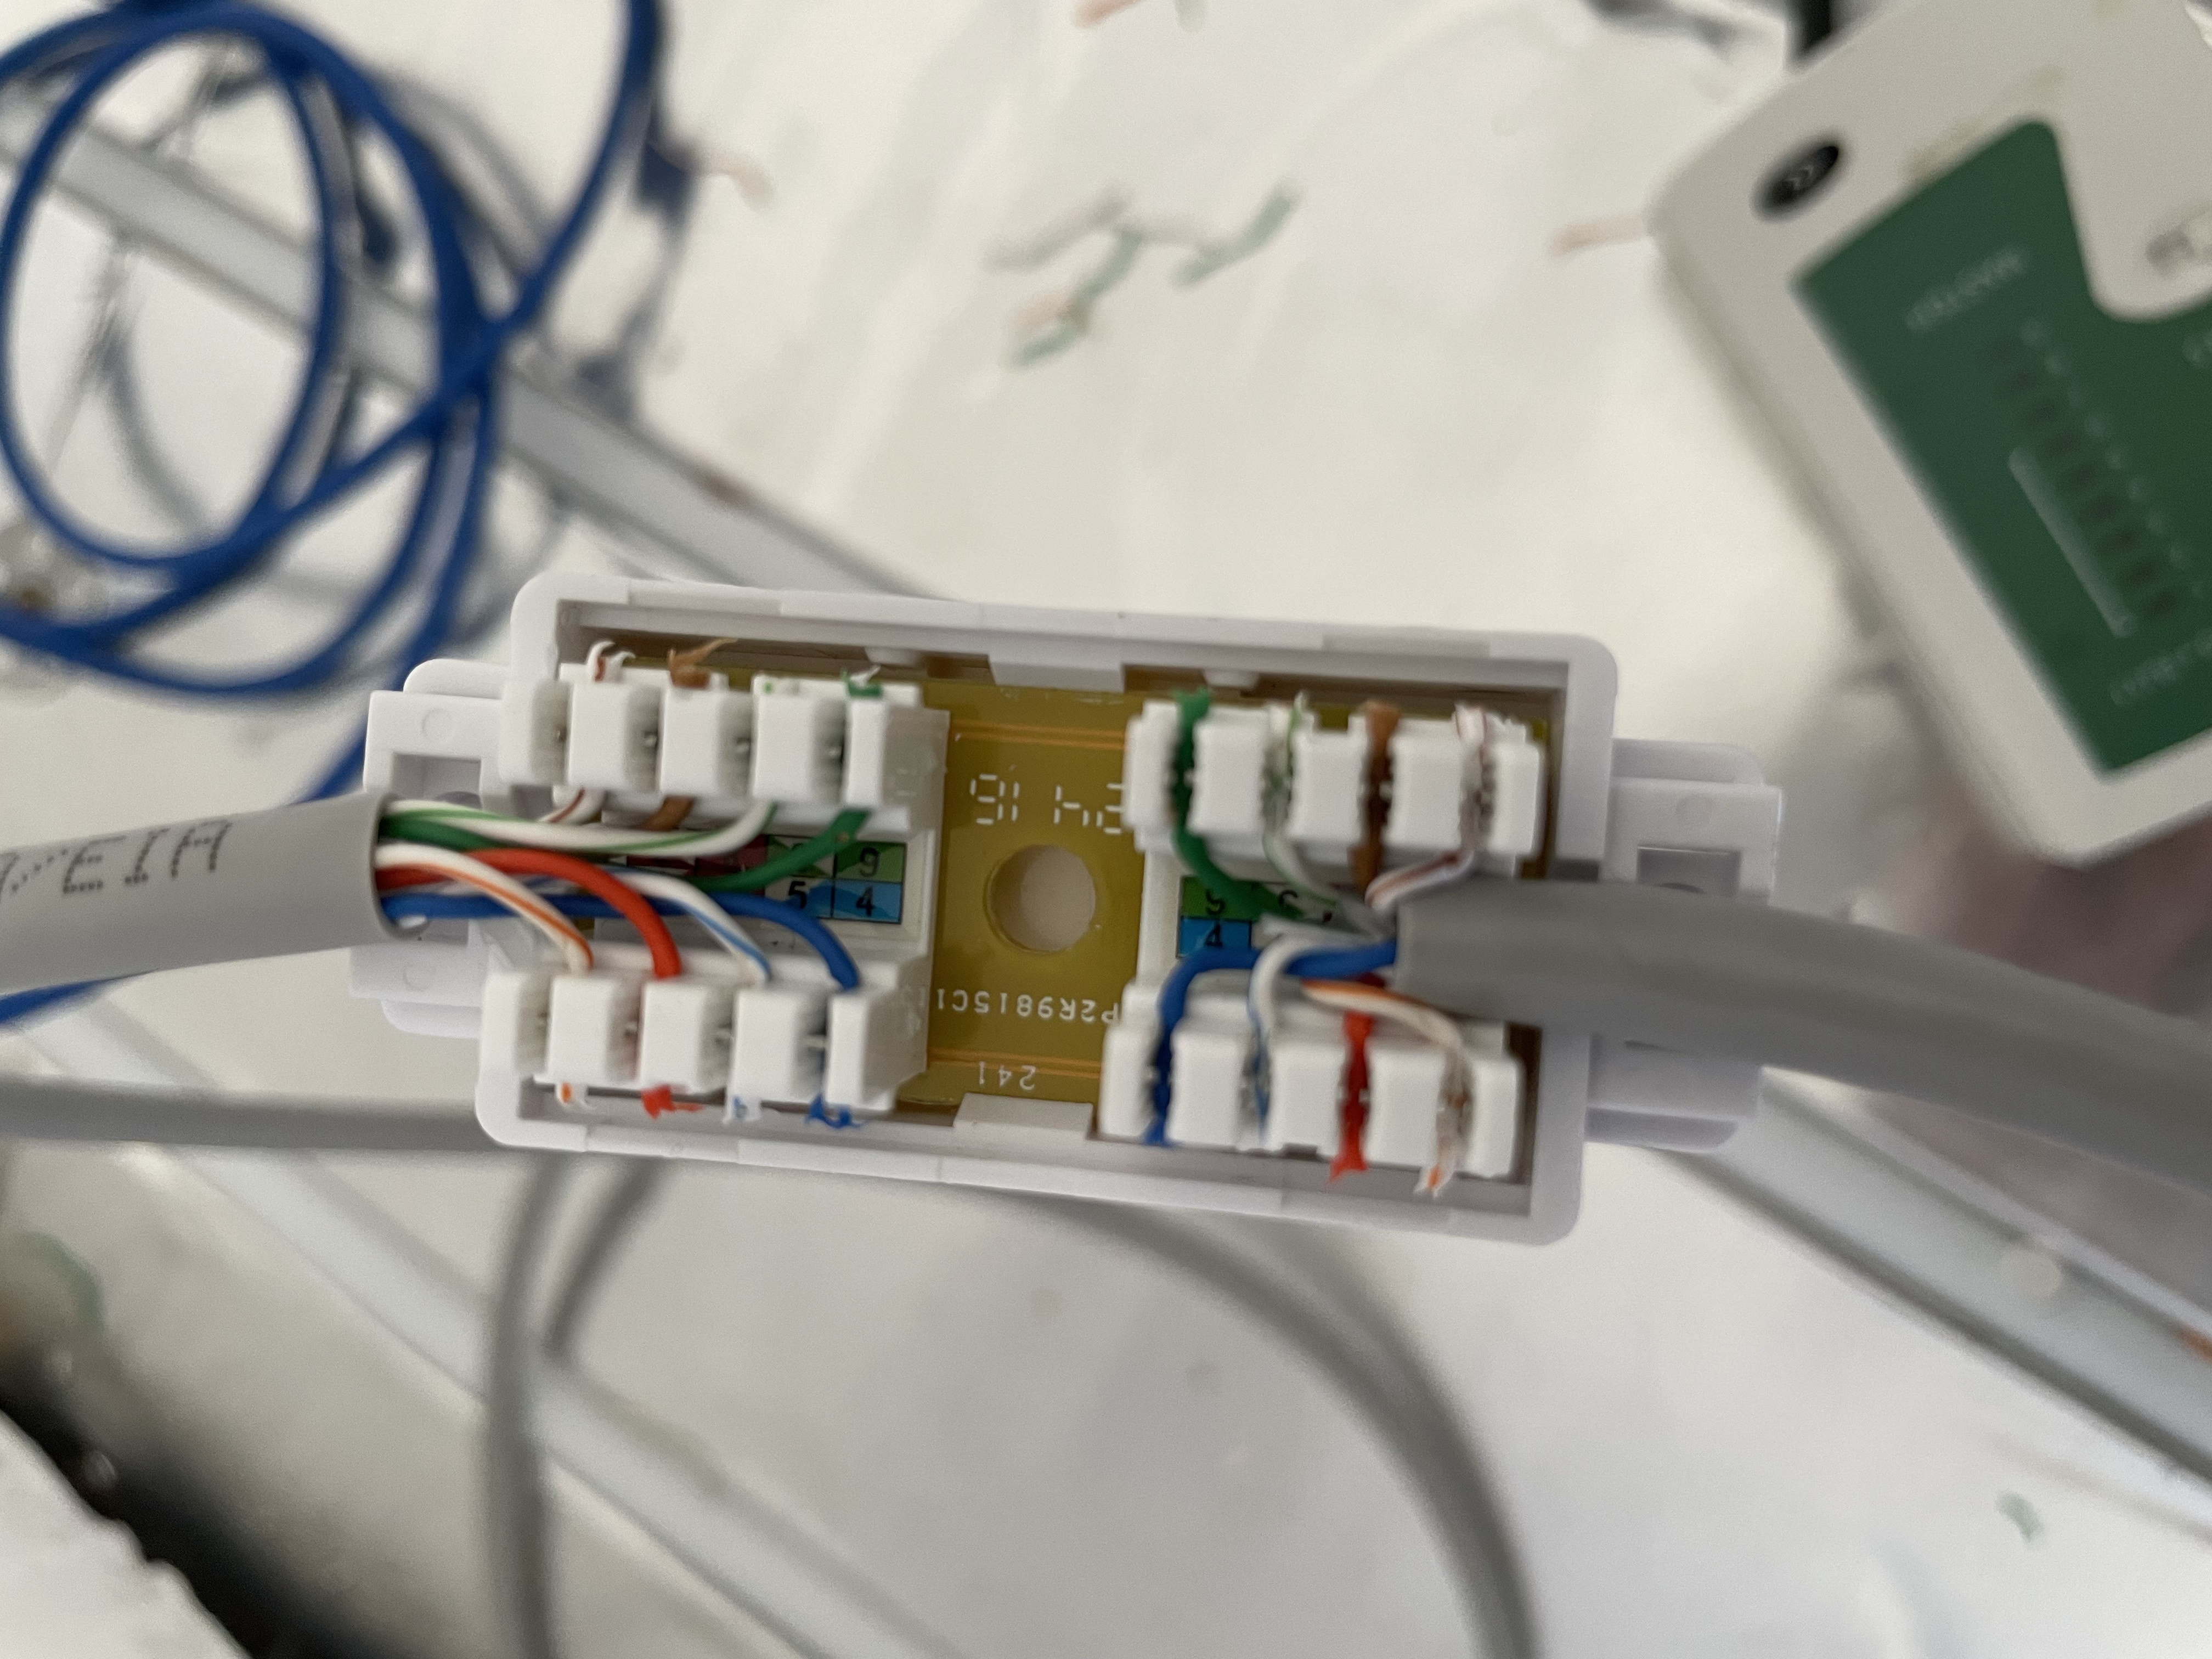
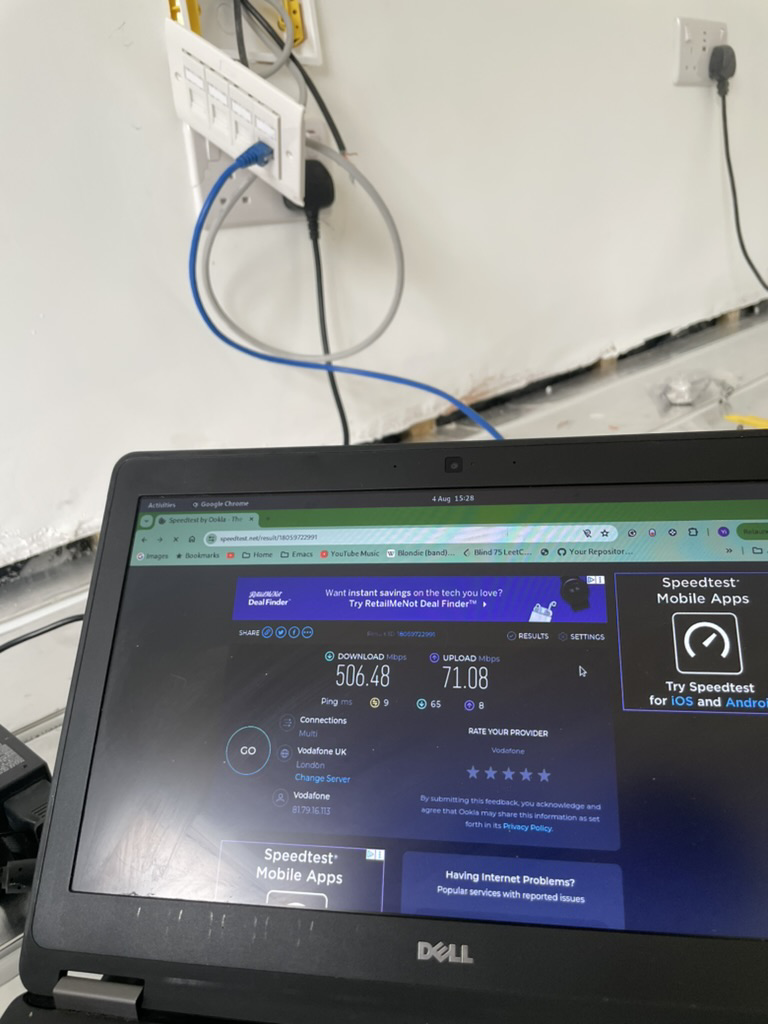
It got 2 terminate blocks built-in, one for the incoming cable, and
one for the outgoing. There is a diagram of the Type B protocol
printed on the product, so I don’t have to look it up on my phone. All
I have to do is punch down the 16 wires one by one. With a quality
punch down tool it is a lot easier and quicker than I thought.
Inline Coupler In Use
The product itself is solid, much better quality than the LAP data
module. I didn’t have to worry about damaging the terminal or face
plate when pushing it against the wall while using a punch-down tool.
The size is on a sweet spot, about 24mm depth, just enough to tuck it
into the 25mm service void. I am not sure if it is maintenance-free or
not, but I am comfortable leaving it in the service void as it has an
enclosing cover on it.
Kenable is the only place that sells it at a reasonable price, about
£2 each, while the rest of the sellers is asking for £5 so thank you
Kenable for making it affordable.
The best time to learn difficult thing is in travelling. During my
last two-week’s trip to Singapore/Malaysian, I was reading about
Ledger Cli causally. without putting much efforts, it clicked. It
suddenly started to make sense to me.
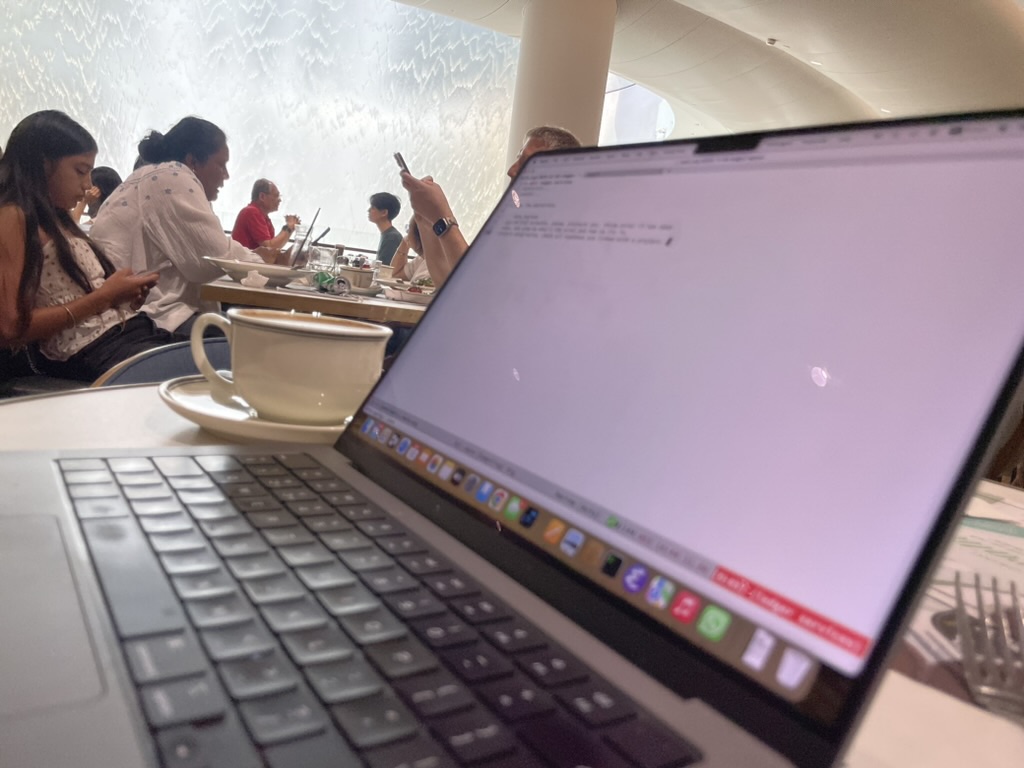
The more I learn, the more I want to learn more. I cannot wait for the
next opportunities to open Emacs and dive into Ledger’s brilliant
documentation. This is me with my Emacs in Changi Airport next to the
Jewe.
Emacsing next to the Rain Vortex in Changi Airport
I was able to apply the learning and came up with the project-rule to
keep data hygiene (will blog next). The positive feedback energise
me. The flight to London is ready for boarding but I don’t want stop
exploring during the 14 hours flight without WIFI.
That’s where I re-discovered the Info documentation system. I used it
to read the ledger.el library between sleep sessions 8000 feet above
the ground. Reading in plain text inside of Emacs has great benefits,
no distractions, fraction free in taking notes. it was a breeze.
Then I stepped into learning the Info documentation system itself, how
to navigate, search text/index and all that. I was able to pick it up
quickly, the concepts and shortcuts are native to me as an experienced
Emacs user.
Why Info is not Popular?
I envisioned myself to use it to read all the documentation,
e.g. Pandas library’s in Python. That would be ideal I told
myself. However, I soon realised that Info documentation system is a
niche tool: it is mostly used in GNU projects and Emacs libraries.
Why it is no popular? I was wondering myself. I decided to have a go
myself. well, the journey to start is already full of hiccups. This is
typical theme in learning legacy system, and could put many people
off.
So there are few notes that helped me to learn Info. Hopefully it can
bring more new users to the Info system.
dir the Index File
The first and most important thing I realised is, in the context of
Info, the dir is not a directory, but a plain text file. I simply
call it index file, then the rest becomes so much clearer.
The =dir=/index file is the entry point of the Info program. it has a
lists of the available Info manuals with their name, Info file
location, and desecration.
Setup Info in MacOS
Then there is a bug in emacs-plus: during the installation of Emacs,
the dir file somehow got deleted in the cleaning process. So the
manuals for the default libraries that comes with Emacs are not
available. In my case, I only have few Info from the packages I
installed post-installation, like orderlies, org-roam for example.
I took a slightly different approach to fix this problem: I kept the
system level tools separate from the Emacs’s library, so i have two
dir files.
# manuals of system level programscd /opt/homebrew/share/info
for file in*;do install-info "$file"dir;done# manuals of Emacs and Emacs librariescd /opt/homebrew/share/emacs/info
for file in*;do install-info "$file"dir;done
Then tell Emacs the locations of those dir files as below.
Note, the convention is for each directory in the list, there is a
dir file, on in Emacs, we are specifying the file using directory,
and the file is happened to be called dir. I feel the naming can be
improved to avoid such confusion!
After restarting Emacs, Info will show there are about 500+ manuals
available, e.g. find tool, mu4e library, and Ledger3.
Lastly, an quick note install-info. As shown above, it is used to
install Info manuals, taking ledger3.info as an example, to install
it requires