Compare RPostgres and RPostgreSQL Package
14 Apr 2016R is a great language for R&D. It's fast to write prototypes, and has great visualisation tools. One of constraints of R is it stores the data in system memory. When the data becomes too big to fit in the memory, we asked the user has to manually split the dataset and then aggregate the output later. This process is inefficient and error prone for a non-technical user.
I started an R development project to automate this split-aggregate process. A viable solution is to store the whole data in PostgreSQL, and let R to fetch one small chunk of the data at a time, do the calculation, and then save the output to PostgreSQL. This solution requires frequently data transferring between these two systems, which could be a bottleneck in performance. So I did a comparison of two R packages that interface R and PostgreSQL.
- RPosrgreSQL
- is supported and developed in the Google Summer of Code 2008 program. It is currently out of development. The last publication is in 2013.
- RPostgres
- is a new package which provides similar functionality to RPostgreSQL but rewrite using C++ and Rcpp. The development is led by Kirill Müller.
Based on my testing, the RPostgres package is about 30% faster than RPostgreSQL.
The testing set-up is quite simple: I write an R script to send data to and get data out from a remote PostgreSQL database. It logs how long each task takes to complete in R. To avoid other factors that can affect the speed, it repeats this process 20 times and use the minimal run-time as the final score. The dataset transferred between R and PostgreSQL is a flat table with three columns and the number of rows varies from ten thousand to one million.
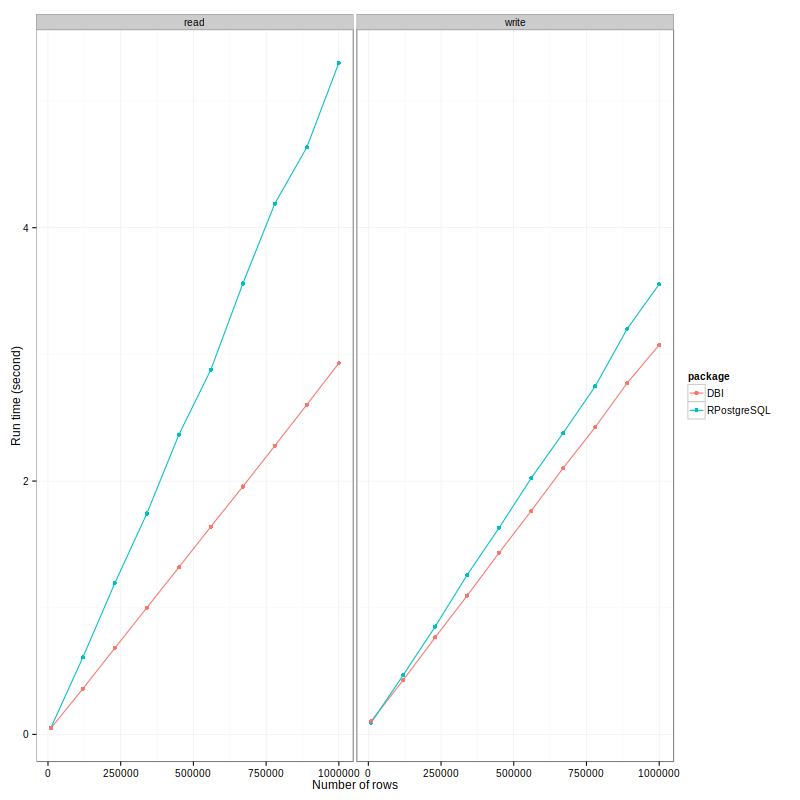
The run-time in seconds are plotted against number for rows for each package and operation.
Here is a summary of what I observed:
- RPostgreSQL is slower than RPostgres. For getting data out, it's 75% slower, which is massive! For writing, difference is closer, it's about 20%. When combine both scores together, it is about 33% slower.
- Particularly, it's slower to read than to write for RPostgreSQL package, the ratio is about 1.5. While as it's quicker to read than to write for RPostgres, the ratio is about 0.8. This is an interesting observation.
- Both package has a nice feature - the reading/writing time linearly depends on the number of rows. This makes the time estimation reliable. I would be confident to say that for 2 millions rows, it takes RPostgres package about 6 seconds to read.
I don't why which part of implementation makes the RPostgres faster. I guess its the usage of C++ and the magical Rcpp package.
Here is the script just in case you want to your own tests.
library(data.table)
library(ggplot2)
library(microbenchmark)
library(RPostgreSQL)
library(DBI)
                                        # config for PostgreSQL database
host.name <- NULL
database.name <- NULL
postgres.user <- NULL
postgres.passwd <- NULL
postgres.port <- NULL
temporary.table.name <- NULL

                                        # config for testing
nrows <- seq(10 * 1e3, 1 * 1e6, length = 10)
repeats <- 20


                                        # open PostgreSQL connection
pg.RPostgreSQL <- dbConnect(dbDriver("PostgreSQL"),
                           host = host.name,
                           dbname = database.name,
                           user = postgres.user,
                           password = postgres.passwd,
                           port = postgres.port)
pg.RPostgres <- dbConnect(RPostgres::Postgres(),
                         host = host.name,
                         dbname = database.name,
                         user = postgres.user,
                         password = postgres.passwd,
                         port = postgres.port)

ReadWriteWarpper <- function(pg.connection) {
                                        # helper function
    write <- function() dbWriteTable(pg.connection, temporary.table.name, dt, overwrite = TRUE)
    read <- function() dbReadTable(pg.connection, temporary.table.name)

    var <- list()
    for (n in nrows) {
                                        # create a dataset
        dt <- data.table(x = sample(LETTERS, n, T),  # character
                        y = rnorm(n), # double
                        z = sample.int(n, replace=)) # integer

                                        # read and write once first.
        write()
        read()

                                        # run and log run-time
        res <- microbenchmark(write(),
                             read(),
                             times = repeats)

                                        # parse
        var[[as.character(n)]] <- data.table(num_row = n,
                                            operation = res$expr,
                                            time = res$time)
    }

                                        # aggregate and return
    rbindlist(var)
}

                                        # run
df0 <- ReadWrite(pg.RPostgres); df1 <- ReadWrite(pg.RPostgreSQL)
df0$pacakge <- "RPostgres"; df1$package <- "RPostgreSQL"
df <- rbind(df0, df1)
plot.df <- df[, min(time) / 1e9, .(num_row, operation, package)]

## generate plot
plot.df[, operation := gsub("\\(|\\)", "", operation)]
ggplot(plot.df, aes(x=num_row, y=V1, col = package)) +
    geom_path() +
    geom_point() +
    facet_wrap(~operation) +
    theme_bw() +
    labs(x="Number of rows",
         y="Run time (sec)"
         )