Data processing time will becomes longer and longer as the increasing
rate of data volumes. Users may check-in frequently to see the whether
it is finished. Most of the time they will found it hasn't, doing this
the users make contact switch which break the flow of whatever the
using was doing.
Sometimes the user can't stop doing so, either because they are
impatient, or because they really have a deadline to catch. Also, with
less likelihood, they might find errors in the processing, either
because of the QC check fails, or running out of computational
resources.
Giving this fact, it really makes sens to have your program actively
inform the user on the process so that they doesn't need to check-in
at all. Because users will be notified immediately whenever the
whole progressing is completed, or there's error that the user needs
to take action onup.
This blog posts walk though the basics of sending Emails in Python,
composing and sending out Emails. Each component is broken down into
small piceses. It helps you debug/tests Email program, and personalise
your Emails. In the end, you should be able to build a email robot.
Prerequisite
Before going into the technical details, you have to check that you
are able to send out emails. You need the
[ ] SMTP server,
[ ] user name,
[ ] password,
[ ] port number, and
[ ] communication protocol.
You could easily found out these information from your Email service
provider. An example of Gmail is at Here.
To check if you have all the information correct, run the following
snippet. It will try to send out an empty Email to yourself. Make
sure you fill in the username and password before hit go.
importsmtplibusername=<FillIn>password=<FillIn>conn=smtplib.SMTP("smtp.gmail.com")conn.starttls()# set connection to TLS mode
conn.login(username,password,)# Log in to the remote server
conn.sendmail(username,[username],'For testing')# Send emails
conn.quit()# close connection.
If you don't see error messages, that's great, you are all set.
There should be an Email in your Inbox. It has no subject and for
testing in the main body.
If you do, you need to double check the information, and try
again. If you are sure that the information are correct, btu still
can't send out, check your network configuration, maybe the firewall
block the connection.
Once you are able to send out an empty email the next is to compose
an full Email.
Compose An Email in Python
An Email is consisted of multiple parts, the Subject, Body,
attachments, Signature, and also some meta-data including from, to,
and date.
Firstly, create an object of MIMEMutiple() class. It will be the
building block of your Email. The approached described here is to
add each components into it.
body_txt='''
Hello,
Just to tell you Python is awesome.
'''plain_body=MIMEText(body_txt,"plain")
You could also try to compose an complex HTML email in Python, or
use diffenret tool to generate the HTML and import in Python.
html_txt=r'''\
<html>
<head></head>
<body>
<p>Hi!<br>
How are you?<br>
Here is the <a href="http://www.python.org">link</a> you wanted.
</p>
</body>
</html>
'''html_body=email.mime.text.MIMEText(html_txt,'html')
Attachment
You can attach files of any type in an Email, specially, for image,
you could use MIMEImage, and for audio, you could use
MIMEAudio.
But you don't have to be specific. MIMEApplication would be
sufficeincy for all cases. It will configure the file type of the
attached file. Use it as follows:
withopen(fpath,'rb')asfp:part=MIMEApplication(fp.read(),Name=basename(fpath))# file content as string
part['Content-Disposition']='attachment; filename="%s"'%basename(f)# attachment description.
msg.attach(part)# attach to the msg.
Put Everything Together
fromos.pathimportbasenameimportsmtplibfromemail.mime.applicationimportMIMEApplicationfromemail.mime.multipartimportMIMEMultipartfromemail.mime.textimportMIMETextfromemail.utilsimportformatdate# Configure your email
username=<Fillin>password=<Fillin>recipents=<Fillin>subject='Hey'attachments=[]# add attachment here.
body_txt='''
Hello,
Just to tell you Python is awesome.
'''# Email - meta data
msg=MIMEMultipart()msg['From']=usernamemsg['To']=', '.join(recipents)msg['Subject']=subjectmsg['Date']=formatdate(localtime=True)# standard.
# Email - main body
plain_body=MIMEText(body_txt,"plain")msg.attach(plain_body)# attachments
forfpathinattachmentsor[]:withopen(fpath,'rb')asfp:part=MIMEApplication(fp.read(),Name=basename(fpath))# file content as string
part['Content-Disposition']='attachment; filename="%s"'%basename(fpath)# attachment description.
msg.attach(part)# attach to the msg.
# send out email
conn=smtplib.SMTP("smtp.gmail.com")conn.starttls()# set connection to TLS mode
conn.login(username,password)# Log in to the remote server
conn.sendmail(username,[username],msg.as_string())# Send emails
conn.quit()# close connection.
Wrap everything in a Class
At JBARML, we are planing to send users emails for a progress
update. Many of the data generating process are lured together and
automated by a workflow manager. The whole programcan takes upto
weeks to complete. Actively sending update progeress to user is
much more senssible then user loggin in to a remote machien and
check it now and then.
In this case,
email to notify user the progress of the data
generating workflow.
Here is what tried to build a TAG for multiple R packages. It enable
me to jump to a location where the function/variable is defined and
modify if I want to.
Useful variable and functions
ess-r-package-library-path
default path to find packages, should
be a list
ess-r-package-root-file
if the folder has DESCRIPTION file, then
the folder is a R package.
(ess-build-tags-for-directory DIR TAGFILE)
build tag on DIR to TARGET.
tags-table-list
List of file names of tags tables to search.
(visit-tags-table FILE &optional LOCAL)
Tell tags commands to use
tags table file.
;; new variable
(defvar ess-r-package-library-tags nil
  "A TAG file for multiple R packages.")

(setq ess-r-package-library-path '("~/tmp/feather/R" "~/tmp/RPostgres/"))
(setq ess-r-package-library-tags "~/tmp/all_tags")

(dolist (pkg-path ess-r-package-library-path)
  (let ((pkg-name (ess-r-package--find-package-name pkg-path)))
    (unless (and pkg-name pkg-path
                 (file-exists-p (expand-file-name ess-r-package-root-file pkg-path)))
      (error "Not a valid package. No '%s' found in `%s'." ess-r-package-root-file pkg-path))
    (ess-build-tags-for-directory pkg-path ess-r-package-library-tags)
    ))
Note the workhorse is ess-build-tags-for-directory which does what
it means. The core of this function use find and etags program.
The find program will find files with extension .cpp, R, nw etc, and
then feed to (using pipe) to the etags program which generate a TAG
table. These two steps are demonstrated in the following snippet,
which is grabbed from the source code of
ess-build-tags-for-directory.
Note when they are used in Emacs, the tags-table-list variable is
appended with the path to the new TAG table. So that the user can use
xref-find-definitions (M-.) to jump (if the point is under a word) or
select which function/variable to jump to. The users then check the
function/variable definition, or modify it if it is necessary. Then
call xref-pop-marker-stack (M-,) to jump back.
R is a great language for R&D. It's fast to write prototypes, and has great
visualisation tools. One of constraints of R is it stores the data in
system memory. When the data becomes too big to fit in the memory, we
asked the user has to manually split the dataset and then aggregate
the output later. This process is inefficient and error prone for a
non-technical user.
I started an R development project to automate this split-aggregate
process. A viable solution is to store the whole data in PostgreSQL,
and let R to fetch one small chunk of the data at a time, do the
calculation, and then save the output to PostgreSQL. This solution
requires frequently data transferring between these two systems,
which could be a bottleneck in performance. So I did a comparison of
two R packages that interface R and PostgreSQL.
is a new package which provides similar functionality
to RPostgreSQL but rewrite using C++ and Rcpp. The development is
led by Kirill Müller.
Based on my testing, the RPostgres package is about 30% faster than
RPostgreSQL.
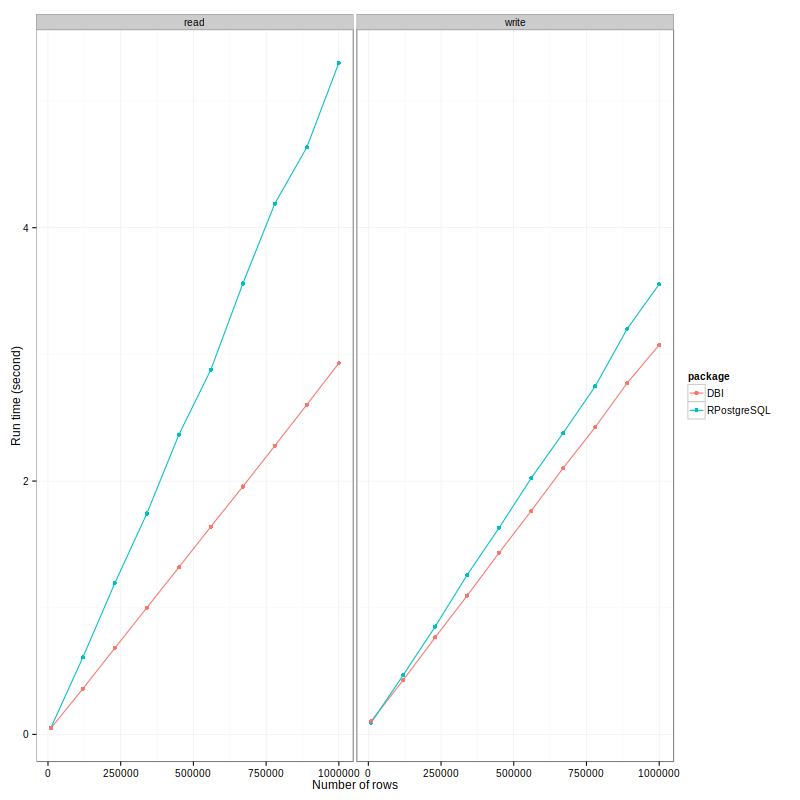
The testing set-up is quite simple: I write an R script to send data to
and get data out from a remote PostgreSQL database. It logs how long
each task takes to complete in R. To avoid other factors that can
affect the speed, it repeats this process 20 times and use the
minimal run-time as the final score. The dataset transferred between
R and PostgreSQL is a flat table with three columns and the number of
rows varies from ten thousand to one million.
The run-time in seconds are plotted against number for rows for each
package and operation.
Here is a summary of what I observed:
RPostgreSQL is slower than RPostgres. For getting data out, it's 75%
slower, which is massive! For writing, difference is closer, it's
about 20%. When combine both scores together, it is about 33% slower.
Particularly, it's slower to read than to write for RPostgreSQL
package, the ratio is about 1.5. While as it's quicker to read than
to write for RPostgres, the ratio is about 0.8. This is an interesting
observation.
Both package has a nice feature - the reading/writing time
linearly depends on the number of rows. This makes the time
estimation reliable. I would be confident to say that for 2
millions rows, it takes RPostgres package about 6 seconds to
read.
I don't why which part of implementation makes the RPostgres faster.
I guess its the usage of C++ and the magical Rcpp package.
Here is the script just in case you want to your own tests.
library(data.table)library(ggplot2)library(microbenchmark)library(RPostgreSQL)library(DBI)# config for PostgreSQL databasehost.name<-NULLdatabase.name<-NULLpostgres.user<-NULLpostgres.passwd<-NULLpostgres.port<-NULLtemporary.table.name<-NULL# config for testingnrows<-seq(10*1e3,1*1e6,length=10)repeats<-20# open PostgreSQL connectionpg.RPostgreSQL<-dbConnect(dbDriver("PostgreSQL"),host=host.name,dbname=database.name,user=postgres.user,password=postgres.passwd,port=postgres.port)pg.RPostgres<-dbConnect(RPostgres::Postgres(),host=host.name,dbname=database.name,user=postgres.user,password=postgres.passwd,port=postgres.port)ReadWriteWarpper<-function(pg.connection){# helper function write<-function()dbWriteTable(pg.connection,temporary.table.name,dt,overwrite=TRUE)read<-function()dbReadTable(pg.connection,temporary.table.name)var<-list()for(ninnrows){# create a datasetdt<-data.table(x=sample(LETTERS,n,T),# charactery=rnorm(n),# doublez=sample.int(n,replace=))# integer# read and write once first.write()read()# run and log run-timeres<-microbenchmark(write(),read(),times=repeats)# parse var[[as.character(n)]]<-data.table(num_row=n,operation=res$expr,time=res$time)}# aggregate and returnrbindlist(var)}# rundf0<-ReadWrite(pg.RPostgres);df1<-ReadWrite(pg.RPostgreSQL)df0$pacakge<-"RPostgres";df1$package<-"RPostgreSQL"df<-rbind(df0,df1)plot.df<-df[,min(time)/1e9,.(num_row,operation,package)]## generate plotplot.df[,operation:=gsub("\\(|\\)","",operation)]ggplot(plot.df,aes(x=num_row,y=V1,col=package))+geom_path()+geom_point()+facet_wrap(~operation)+theme_bw()+labs(x="Number of rows",y="Run time (sec)")
I've always wanted to create a GIF using Emacs to demonstrate some
features, it just looks so cool. I finally got a chance after
attending the Leeds Code Dojo. The final exercise is bit unusual; we
have to write a basic expression evaluation program without using the
eval function in whatever language we choose. The first problem we
had was to figure out the order of sub-expression to evaluate. For
example, in (5 * (2 + 1) ) expression, we know we firstly add 2 to 1
to get the 3, and then multiply 3 by 5. It sounds trivial but it is
actually hard to write a program to do that.
I used regular expression1 to locate the most inner
expression to evaluate, then replaced the expression with its
evaluating result, and continued these two steps until there was no
expression2.
The above GIF shows each step in a expression evaluation program
written in Emacs Lisp.
This post show how to make GIF in Emacs on Ubuntu system.
Dependencies
There are three packages to install first. We need recordmydesktop
to capture the motion of the screen, mplayer to view the video, and
imagemagic to convert the recorded video into GIF file. They can be
installed easily using the apt-get command, as in the following bash
shell script:
On Emacs side, I use camcorder package to control the
workflow. It is hosted in MELPA repository, and can be installed by
(package-install 'camcorder)
Then everything should work nicely together.
Workflow
After these packages are installed, creating a GIF is simply, only
requiring three steps.
1. Initiate the recording
In Emacs,
Switch to the buffer we want to record, let's call this buffer the
recording buffer,
Initiate the recording by M-x camcorder-record command,
Choose where to save the video file, then
A new frame with the recording buffer will pop up. It is wrapped inside
a white rectangular box. Everything inside the box will be recorded and
saved in the video file. Note, if we move the window or overlay it
with other windows, we probably get undesired results.
2. Record
Choose the recording buffer/frame,
Press F-11 to pause/resume,
Show some cool things,
Press F-12 to stop,
Note the demonstration must have an effect on the recording buffer, and
we can use with-current-buffer function to dump the output for a
particular buffer, for example,
(with-current-buffer "Demo_Buffer"
  (insert "Start to demo: "))
will insert "Start to demo: " into the Demo_Buffer.
I found it is useful to wrap the demonstration into a function and
bind to a key because I will probably run it many times.
(defun yt/camcorder-show-off ()
  (interactive)
  (goto-char (point-min))
  (insert "going to show you something cool, don't blink your eyes.")
  (sleep-for 2)
  ;;;; apply some functions
  (insert "\nExciting isn't?"))

(define-key camcorder-mode-map [f5] 'yt/camcorder-show-off)
There are two functions that are helpful control the flow. Use
sleep-for function to let the program wait few seconds, and use
y-or-n-p to let us choose whether to proceed or switch flow.
3. Make gif
After the demo is finished,
Type M-x camcorder-convert to convert a video file to a GIF file,
Choose a file name for the GIF file,
Select convert method, and choose use mplay with imagicstick.
We probably repeat the step 1-3 multiple times until we are happy
with the GIF.
My MacBookPro's hard drive stooped working last week and I managed to
recover most of the data from a Time Machine back-up 6 months ago. But
I couldn't get the mu4e and mu working. I feed up with googling,
trying, and decide to immigrate to Ubuntu. It would save me from a
lot of frustrations and time in making my Mac and office PC work the same
way.
Ideally, I will built a Ubuntu on Mac which is exactly the same as the
one on my office PC, by just copy over everything 1. As a minimalist, I
decided to build the system from scratch and install software one by
one so that I can have an better understanding of what are the
necessities for me.
In the last few days, I become extra mindful about the what and how I
used the Ubuntu system in the office, and realise the things I need
can be grouped into three categories:
Configuration,
the .ssh folder for the ssh-agent,
the .fonts folder for new fonts,
the .mbsynrc file for sync emails,
the .ledgerrc.
Software for
Development: like git, gcc, Emacs, and R.
Writing: org-mode, LaTeX,
Email: mu, mu4e, and mbsync.
Finance: ledger.
Personal git repositories
public reposity on GitHub,
private reposities on BitBucket
For 1), since they are small, I can zip up and copy over, or even
better, create a git repository so that sync on two machines becomes better
easier.
For 2), I need to find the software's package name in the Ubuntu's
software repository, and then install all of them by a script. The
dependencies should be resolved automatically.
For 3), I need to create a shared folder between the host system and the
Ubuntu system, and then copy over the ~/git/ folder.
It really sounds like a plan! I am going to download the Ubuntu
installation file now and hopefully the transition will be very smooth.